May 2019
One Snap and You're on the MAPP....
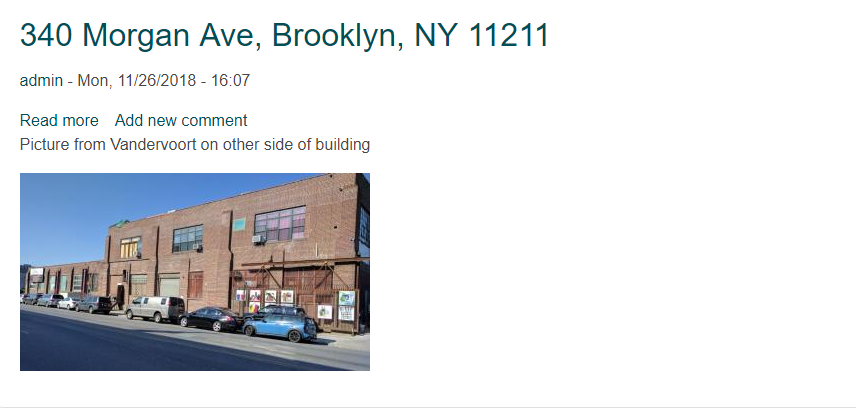
All it takes is one picture with the Geo-Location feature turned on and MappSnap does the rest. Industrial space only - for sale or rent. Entire buildings or parts.
We've taken MappSnaps throughout Los Angeles and New York. We have MappSnaps for most of Vernon, Gardena, East Williamsburg-Bushwick, and many of the larger buildings in the Los Angeles area. Take a MappSnap and we do the rest.
Make sure to see:
January 2019
Our first program is called MAPP and stands for Map Application. We use it daily for the real estate intelligence we derive. MAPP combines U.S. Parcel and Ownership information along with our own "street-level" data. MappSnap takes the concept one step further by adding user generated content as simple as taking a picture or Snapshot. MappSnap aggregrates mapping, parcel, and local point data in one web application usable on either a smartphone or computer. By using both custom data along with GeoData, we are better able to find more industrial real estate deals for our clients.
November 2018
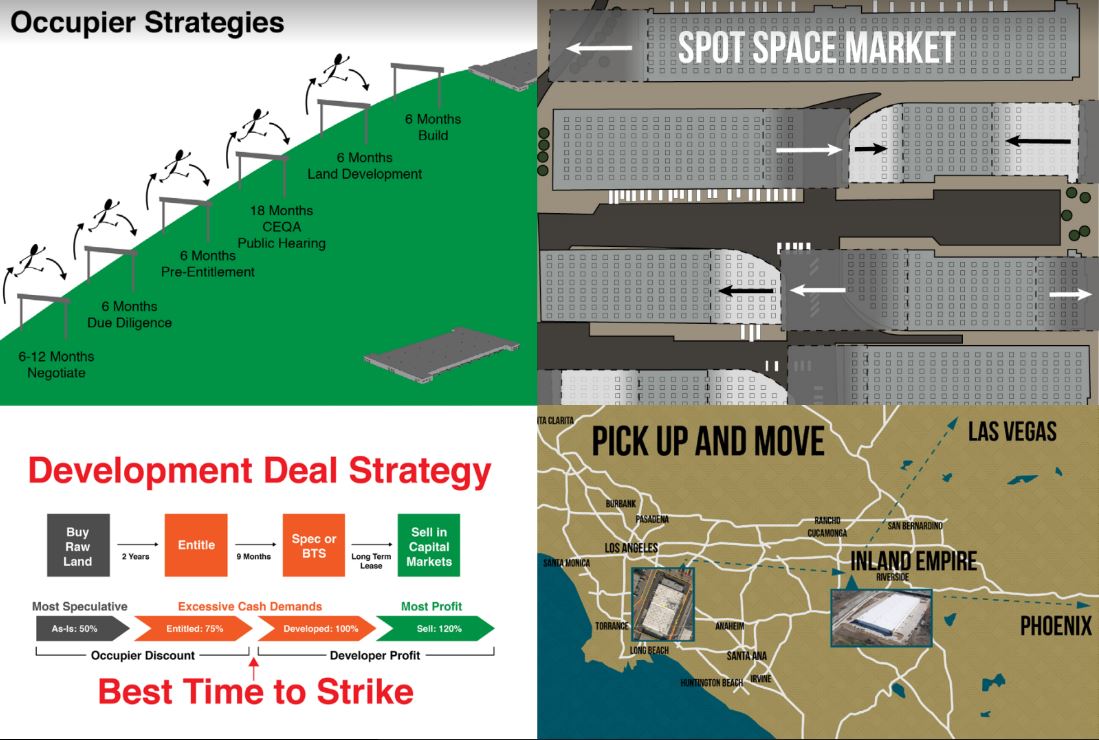
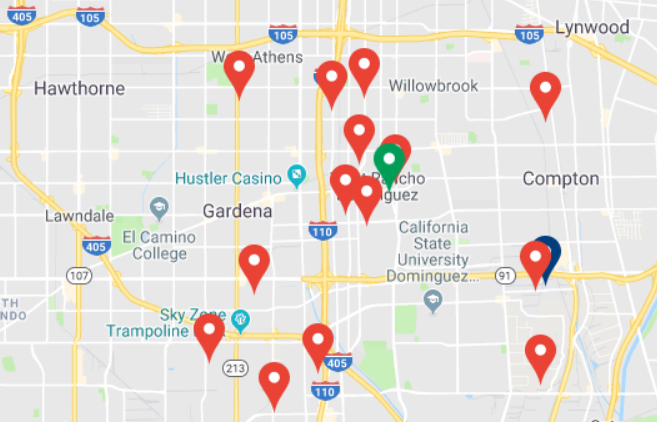
Now that we have collected a data warehouse filled with Big Industrial Properties across the U.S., we started applying intelligence to many of the relationships we created. These relationships are illustrated more carefully in the taxonomies and strategies. We are predicting the properties our clients want based on their current business model and historical patterns. Above is one example we use for Occupiers. Many companies will either expand or relocate from Los Angeles. Many will move to new buildings.
October 2018
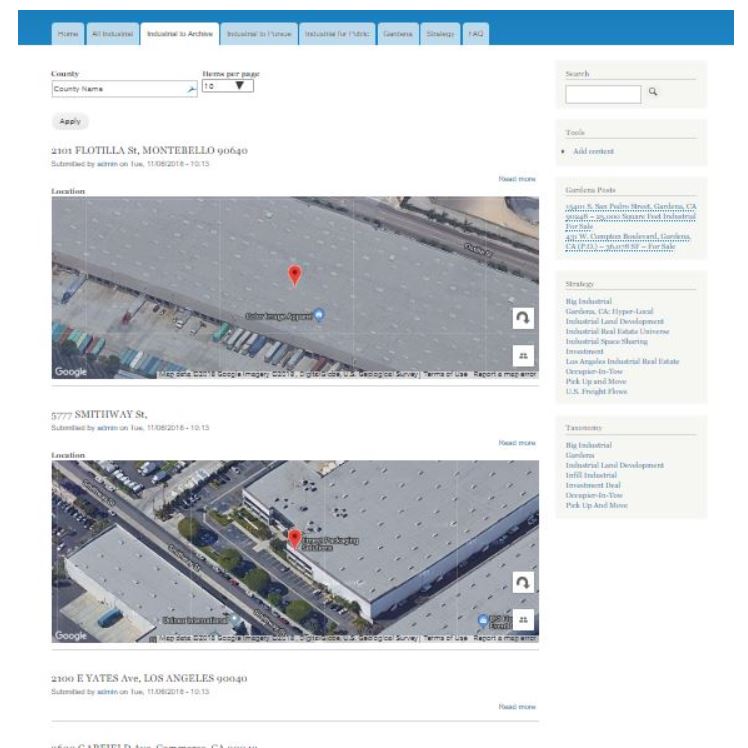
We've finally integrated Salesforce, GIS, and Drupal into a platform to find and sell big industrial buildings across the U.S. Not all our legacy applications have made the move but they will early next year. Our favorite feature so far is geotagging in the street and have the location immediately appear in the building inventory. It's the easiest way to generate user content on the MappSnap Platform because all you need is a picture. The immediacy is how we keep up with fast markets as widespread as New York, Dallas, Los Angeles, and cities in Europe. We have become an analytics business using industrial real estate data to create and serve deals to our customers. Most importantly, we would not have success without the personal support of many longstanding clients.
August 17, 2017
After spending the weekend at DrupalCamp at UC Irvine, I came away with a lot of different ways to use Drupal. I'm sticking to their original theme and using it to post deals. While I haven't worked out all the bugs, Industry Lands can post space and register users. While I stray from time to time, the focus is where I have the most contacts - Gardena, Industrial Investment, Big U.S. Industrial, and Infill Industrial. I also experiment in close-in New York and Downtown L.A. My customers want to grow net worth by investing in industrial property. Industry Lands serves as a platform to find property, occupiers, and investors. Industry Lands is fed by a GIS databse we created called MAPP and it contains all U.S. industrial parcels, tenants, and investors.
June 15th, 2017
We've reached a small hiatus due to funding. The next step is to create different groups and communities so users can share information and deals - openly, privately and securely. I'll be extending the current Drupal setup with the Groups Module. A bit out of my technical ability but lucky for me I live in Santa Monica with a very active and welcoming Drupal community so hopefully I'll be able to beg and borrow my way through this next phase.
For anyone who would like to use the MAPP app and related tools and is willing to pay, I will use the funds to put back into the project. My goal is to work with you on the deals.
Update on March 9, 2017
The public link has been published on this site but we are still working on passwords and security to the User Side. Naturally, the Private Side has all the “deal” data and controls.
Update on September 20, 2016
Last week, we signed a contract to put part of our data online for registered users to see. We will start with our annotation and media layers that will focus on Big Industrial in major US markets. The big challenge will be getting Occupiers to use the site because they are the drivers of the entire industry. At the same time, we need to have enough space offerings for Occupiers to find the site useful. For now, we’ll only be working on development deals where Occupiers are necessary for financing. Space Sharing is also important because if we can line up two or three tenants for a big building, scale economics will be benefit everyone. Please keep an eye open for log-in information by year end.
Update on April 21, 2016
So far this year we have held off adding any more features to the MAPP Program and instead have been working strictly with the data. There are several predominant trends in this market and we are using data analysis to identify the Occupiers and Landowners who will benefit the most. In every major market there are severe space shortages and rents are surging. Many large warehouse and distribution operations can no longer afford to operate close-in, central locations, especially when you can move to a newer building in the Western Inland Empire and acquire 50% more space for the same price. The same conditions apply to the Bay Area, Dallas, Miami and New York/ Central New Jersey.
By using basic commands we can search our data to find those companies most likely to benefit from these market conditions and at the same time identify Greenfield landowners who have the perfect development sites. In other words, we find the Occupiers who want new buildings and locate the land where they can build.
Without getting into too many details, we’ve isolated several variables (size, location, industry, ownership, zoning) and by coding for those properties, we can make certain matches that would be impossible without large data sets. It’s very simple logic but becomes more complicated when adding new data. Unfortunately, it has taken longer than I thought because finding talented data scientists is difficult. We’ve come to realize, you can actually do very little and achieve excellent results.
Meanwhile, we have discovered the MAPP Program works well on mobile devices and is a perfect reference tool in the field if you want the ability to identify locations on the fly and record them for later.
Update on December 22, 2015 – BatchGeo
BatchGeo
The newest addition to the MAPP Program is a BatchGeo application that can take a list of properties from one large owner, an occupier, or an investor and immediately display ther locations on the map. This makes it easy to compare leased vs. owned properties and see the markets where their properties are loacted. We have also written a script that automatically returns the ownershp information for any given address. It automates a process that would normally take much longer by hand. Here are a few examples.
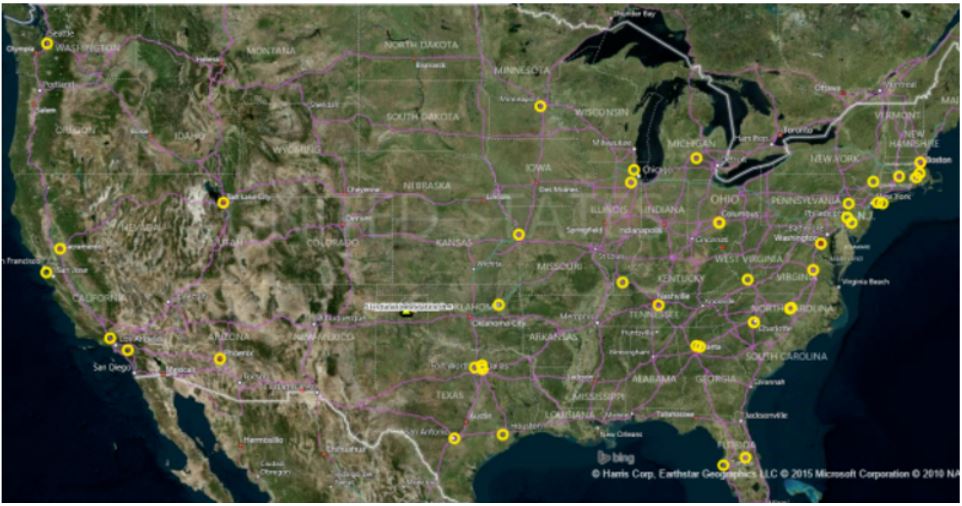
AAA Refrigerated Warehouse Company
(Note, nothing in Northwest and Texas with the potential to open in other parts of the U.S)
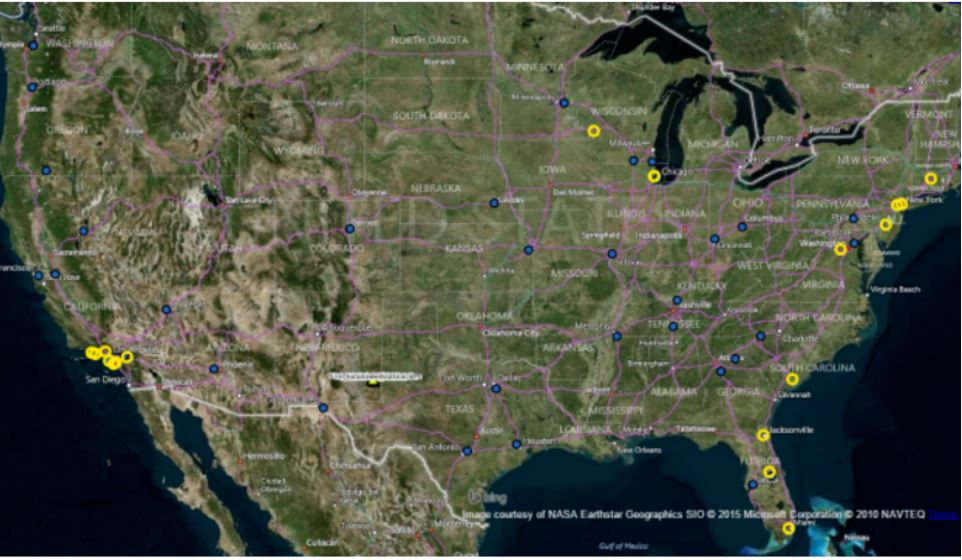
Large Medical Drug Distributor
(Almost in every major market with a few exceptions. Many warehouses are owned)
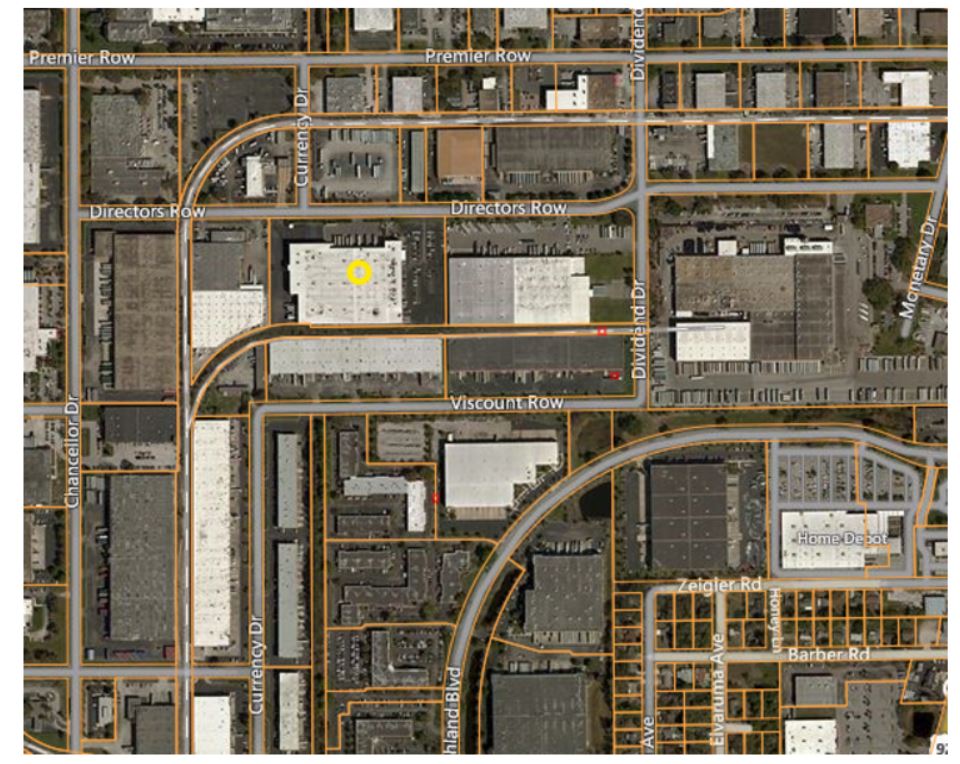
Close-up of Florida Location and Parcel Details
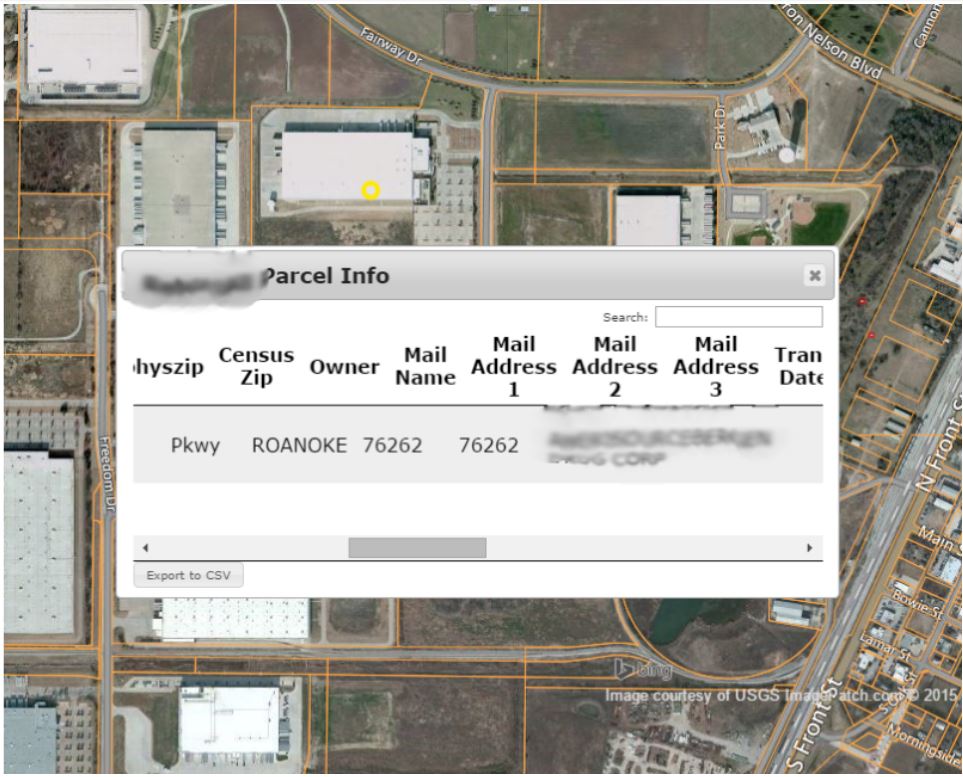
Dallas Location with Ownership Details
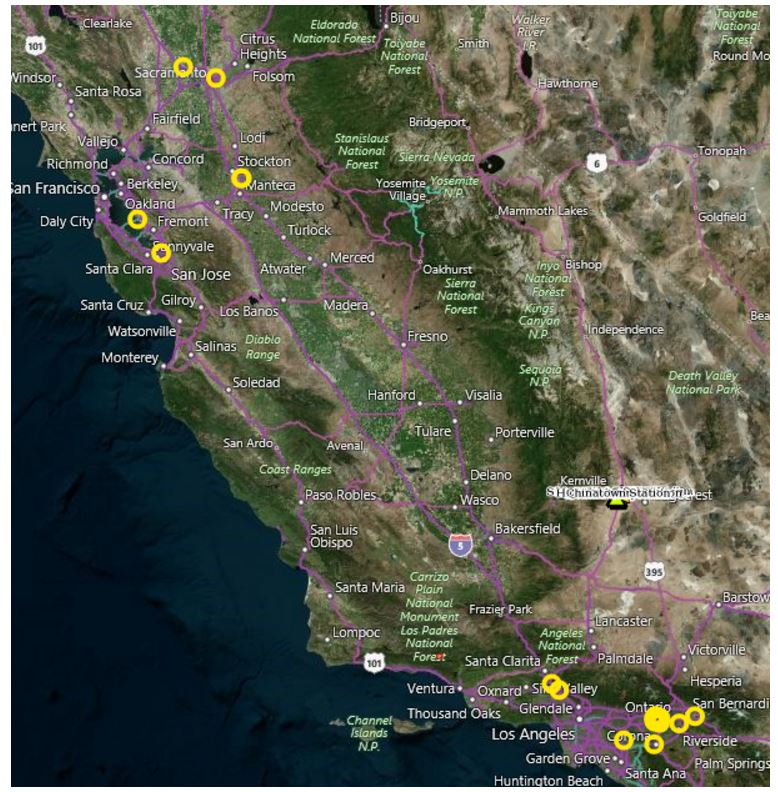
3PL California Locations:
(Shows a fairly regular pattern in both Northern and Southern California; both infill and exurban markets. Mostly leased warehouses.)
Property Scraping
We have also started scraping ownership data in major markets. We have a script to simplify the process that is done by interns. In tandem with the MAPP Program we are able to scrape the data for all Big Industrial nationwide for Property Owners, Occupiers, Land, Land Developers, and Investors. We’ve been able to create a large database we use to find off-market properties, vacant land for development, investors. In many cases we can bring the Occupier forward at an early stage to minimize developer and investor risk while at the same time giving Occupiers a below market deal.
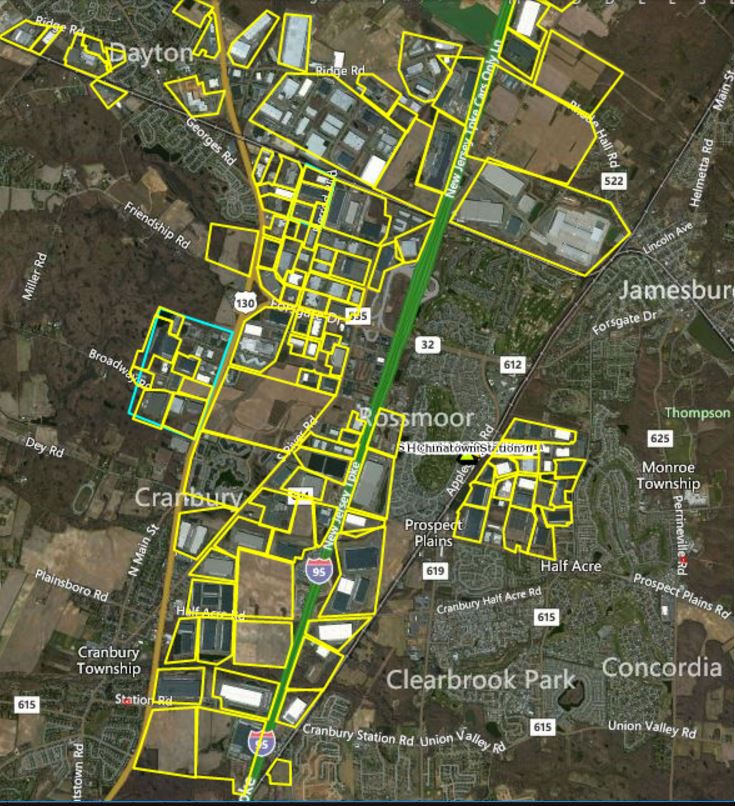
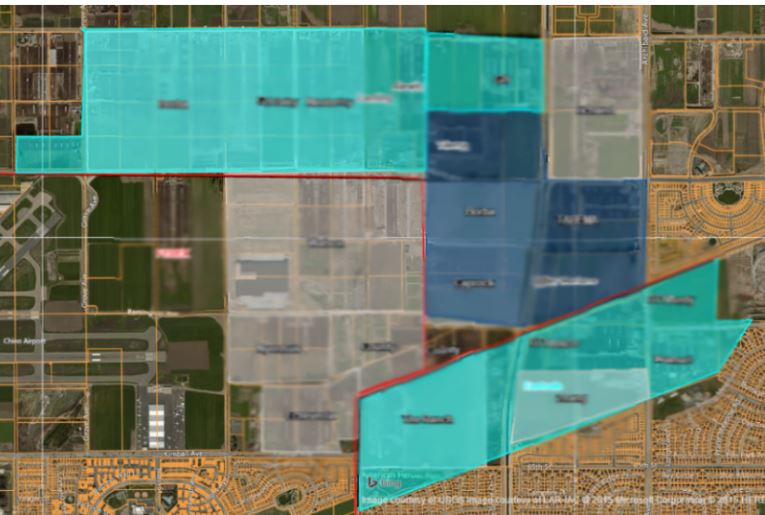
We started mapping Big Industrial in New Jersey:
We have mostly completed mapping Big Industrial in Western Inland Empire:
Starting to Map Big Industrial in Dallas:
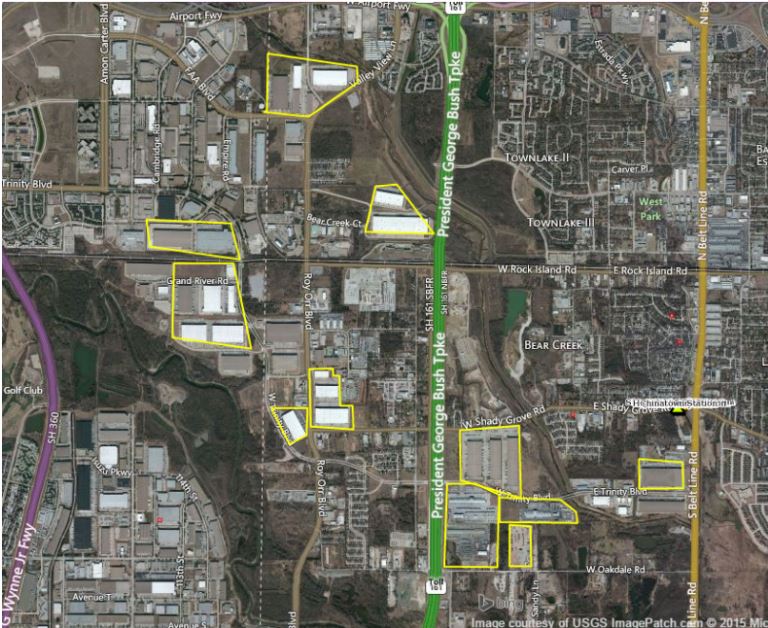
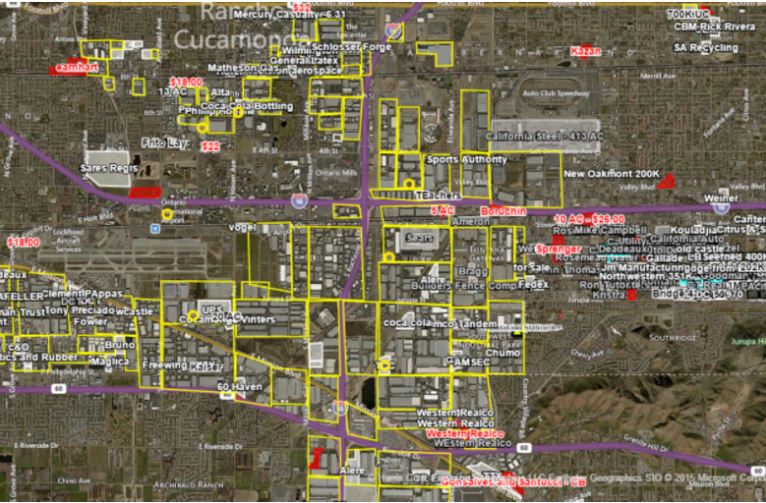
Annotation Layer:
We’ve added a new feature to the MAPP Program. We can now annotate directly on the map with either shapes or text. I’ve been doing land maps like this one around the country identifying large industrial parcels not yet developed. This is an easy way to learn the market.
Update to MAPP Program, April, 2015
Geo-Tagging:
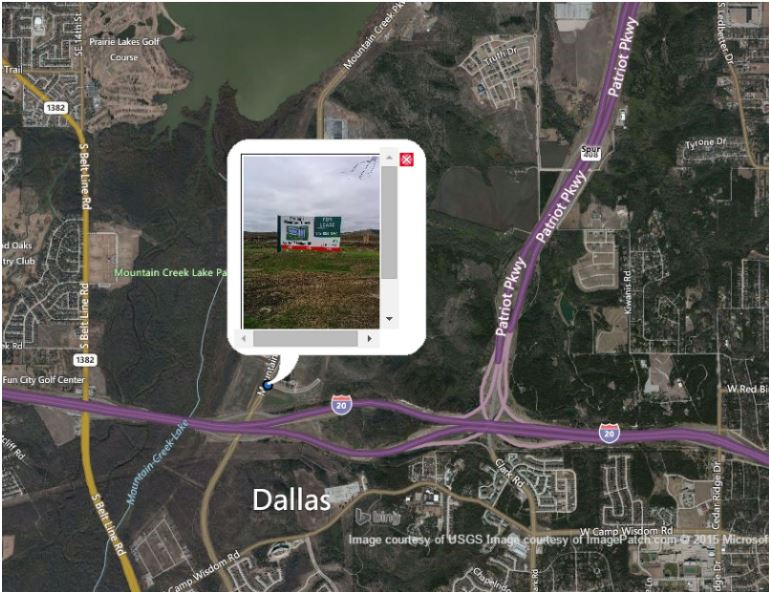
I was at DFW not long ago and the connecting flight was cancelled. I persuaded the airline to book me the following day. In the meantime, I took what few big box listings I had and mapped them out to find where all the big industrial is located particularly new development. With my cell phone camera I drove around the greater Dallas area and geo-tagged all the locations. I think I did a pretty good job and probably caught 80% of the market. Not bad for less than a day. Below are the blue points I created.
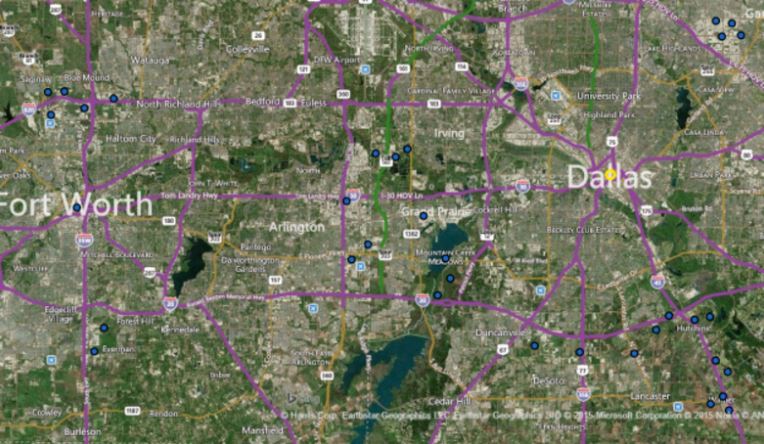
When you click on the dot it opens up the picture I took that also gives the x/y location. This picture is at Mountain Creek Parkway, one of the more beautiful industrial parks I’ve seen next to Mountain Creek Lake.
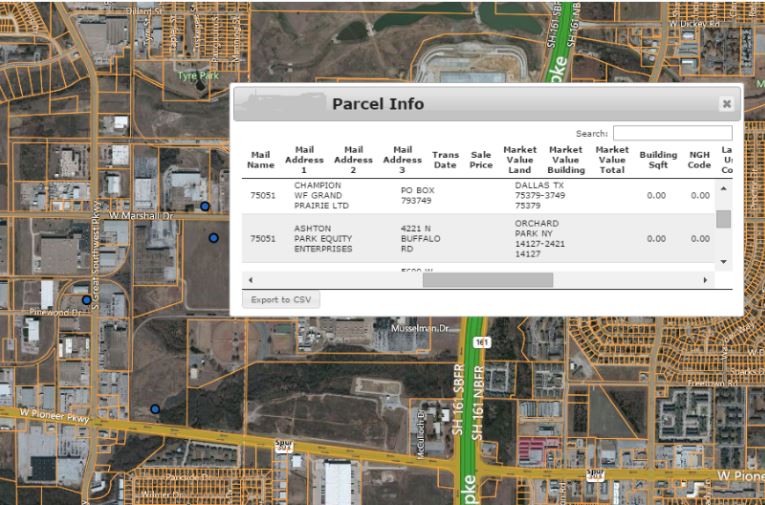
Finally, I moved over to Grand Prairie because it is more built-out and a better area for demonstration purposes. I can highlight the parcels I want and export them into Salesforce to add to my large database of Big Industrial. All these steps combined create a pretty good way to find deals.
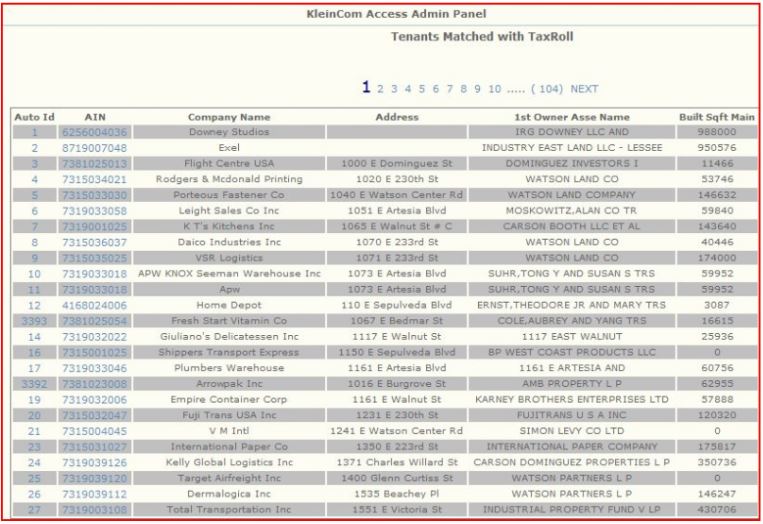
MySQL Backend Databse:
The backend of the MAPP program is run by a MYSQL database that contains all owner information for Los Angeles County, tenants in the markets we work, and available property. When we mash up the data by AIN number, you get some interesting results. For instance, owners of every property, square footage of every tenant, location of every property in a TOD zone, or every building that is served by heavy rail. The database is easily searchable by different criteria to customize specific reports. MAPP or the database separately is a great tool to help owners and tenants. When you combine the two, it’s very easy to search for hard-to-find information. Plus the way the program is designed, we can easily write a new script to provide precise results. If combining SQL and GIS was not enough, we can port the entire program to Salesforce to give us the marketing extension.
For those interested in the entire history of the MAPP project, archives are kept at kleincom.com